Through teaching, I’ve learnt many mathematical concepts at a much deeper level and I am often left asking myself, “why didn’t my teacher teach me like this?”
The ways students are learning maths at school has massively changed over the past 5(ish) years. What students are doing in lessons has been influenced by the availability and advancement of technology, but how the students are learning is continually changing and (I hope) improving. Much of this change in how students learn occurred after quite a momentous occasion in mathematics education: Dan Meyer’s TED talk – Math Needs A Makeover. If you haven’t watched it yet, stop reading this post and watch it. Like so many other maths teachers, I was inspired to be the teacher I wish I had when I was a student. Some are even writing books & blog posts about it! (@TracyZager)
This brings me to Friday’s lesson. I was teaching something that I, as a student, struggled to learn and understand – Periodic functions (more specifically, the changes that occur to y=Asin(Bx+C)+D and cos or tan). I started looking back at the different things I have been trying in the classroom… what took shape was a pretty awesome lesson. One might see this lesson as a progression, which could be run in shorter parts or sections. All of these activities took 100 minutes in total.
Starting with Inquiry – “What do you notice?”
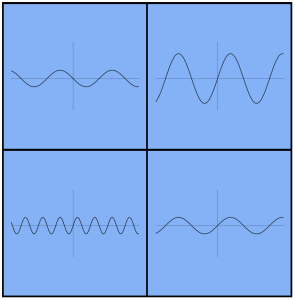
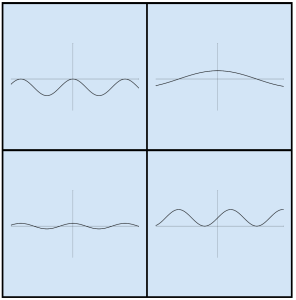
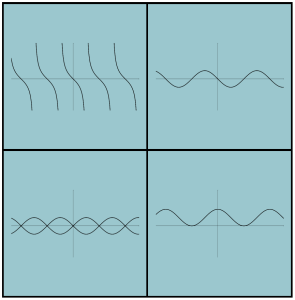
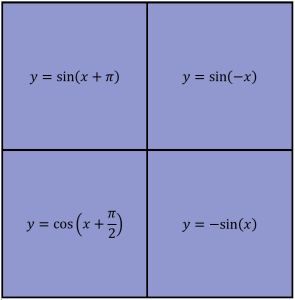
Part 1: Which One Doesn’t Belong
@MaryBourassa @WODBMath wodb.ca
Students make a low-risk, highly open choice about which square they think doesn’t belong. I ask the students to write down their choice and the reason why. The purpose of writing down the reason before sharing it with the class in a discussion is ensure that each students’ initial thought is noted. It also prevents more confident students from dominating the conversation.
These images really harness the students’ inquiry. When paired with questions like, “What do you notice?” these are great for creating a need for learning from the students.
Causing the headache
Part 2: Periodic Functions Polygraph (The Maths Version of “Guess Who?”)
@Desmos teacher.desmos.com
This is one of the many great teacher resources available on Desmos. Students pair up randomly with a peer in the class after entering the class code. One student picks a graph and the other student has to narrow down the available graphs to guess which one their opponent has selected. They do this by asking questions that require a yes/no answer. Here, both students need to think critically about the questions they ask, how they respond, and which graphs it is likely to be.
Click on the image to take you to the version I created and used:

The best element of this activity, for me, was the dialogue that was developed and the terminology that was used or created. I deliberately asked my students to refrain from looking up definitions. I did this because I wanted them to experience what it is like to not have any definition or rule to use. Having the students describe the functions in their own way allowed them to notice what was changing and create their own learning. It wasn’t until after Part 3 of the lesson that I even mentioned “Amplitude”, “Period” or “Phase”.
Harnessing Curiosity – “What happens if you..”
Part 3: Marble Slides: Periodic Functions
@Desmos teacher.desmos.com
This is the ULTIMATE periodic functions graphing activity. After doing 3 or 4 games of the Polygraph activity in Part 2, students moved on to start Marble Slides. Here, students get to play around with the functions they were previously describing in mini challenges to create paths for marbles to follow and hit stars.
Click on the image below to take you to the activity that I used:

This is still one of the most entertaining resources I’ve tried as a teacher. There are reflections embedded throughout the activity and students can see their classmates’ responses after entering their own. Students also get to learn about the importance of different amounts of pi when graphing periodic functions. Here are some of my student responses below:
I then jumped onto the Desmos calculator and played around with the sine, cosine, and tangent functions to consolidate their learning. Throughout Part 3, I stressed the importance of writing down what happened when you changed the A B C & D values, and by the end of the activity every student had a definition for each letter that was in their own words. I then gave them the “proper” terms for them to label their definitions. This really amped up the amount of ownership of the learning and, hopefully, made it more meaningful for the students.
Apply the Understanding – “Now you have the Aspirin, what can we do?”
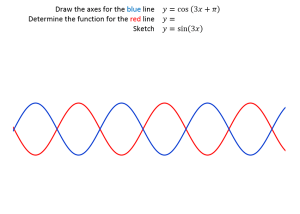
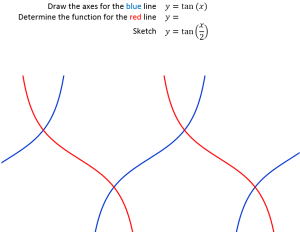
Part 4: Here’s the function, now draw the axes
Inspired by @fawnpnguyen
These problems are my take on Fawn Nguyen’s Reversing the Question. Here, students are required to draw axes and the scale that the functions need to work. As the functions are periodic, these axes may look different from student to student (not much I know!).
-

- A different way of reversing the question

Download the complete worksheet here, or use it as a template to create your own.
Show me what can you do
Part 5: Pepsi Challenge (homework)
I played around with the Desmos calculator and created two versions of the Pepsi logo. Click on the image to take you to the Desmos graph:


I made this problem “real-world” when I discussed the importance of mathematical models in patenting company logos. The challenge was to replicate the Pepsi logo using periodic functions, or another logo (e.g. The ABC Network logo).
#MTBoS
I was asked by a visiting teacher during this lesson about where I hear about these resources and how I “come up” with these ideas. I can honestly say that the MathTwitterBlogoSphere hashtag on Twitter (#MTBoS) has changed the way I approach teaching in general.


This is a great collection of resources! About how much time did you allot to each part?
LikeLike
Thanks! I’m not too sure.. Maybe 25 mins, 20 mins, 35 mins, 20 mins (roughly)? Students completed what they had left on the last bit for homework 🙂
LikeLike