Lesson found here: bit.do/AFLpolynomials
I’ve been lucky enough to be told that I’m teaching Year 10/11 Maths again for the second semester of this year. I’m excited because now I have a reason to show my students how I see maths in different things each day.
The first topic that we are teaching in the second semester will be Polynomials and other Curves. As I have already developed several resources for quadratics, I thought that I’d show my students the importance of Cubic and Quartic regressions.
I did this through analysing an Australian Rules Football match and teaching it in “Three Acts” (a pedagogy developed by Dan Meyer).
Have a look at what I did with the lesson below:
Act One.
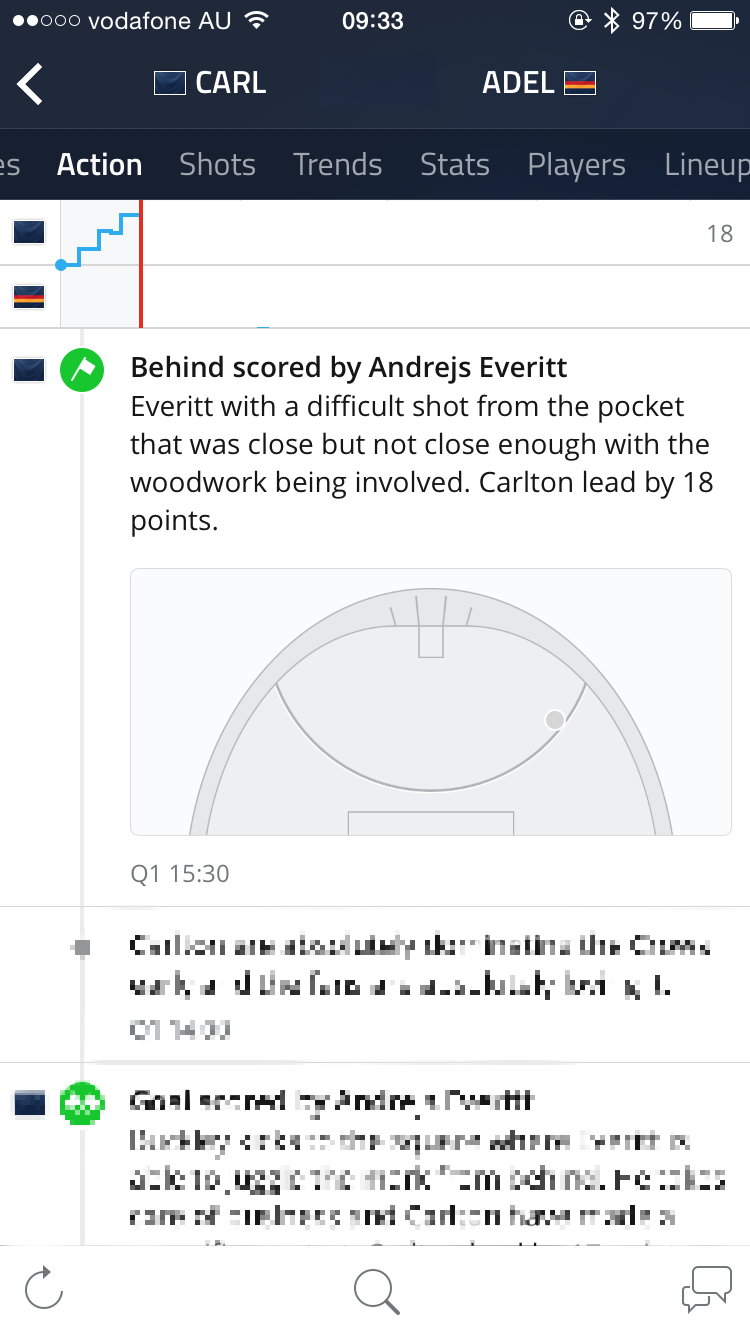
I want to know who won the Carlton vs. Adelaide match but my data ran out on my iPhone. All I have now is a few screenshots I took on my phone.

Who won the match?
Act Two.
The first screenshot looked like this:
 … and the next few looked like this:
![]() How can I use these images to figure out who won the match?
How can I use these images to figure out who won the match?
Who do you think will win and why?
 Then, by using their calculators, students plot the data given for the score difference at 15.5 minutes and the end of the first, second, and third quarters. Here, students are required to have a cumulative time in List 1 and the score difference in List 2. A discussion about the best way to plot the values is essential here.
Using this plotted data, students are then asked to fit a regression model to their data and decide which one(s) are best. This will hopefully lead to a discussion about Cubic vs. Quartic functions. The teacher could ask questions like “What does a Cubic regression imply?” or “What does a Quartic regression imply?” and hopefully receive answers like “a Cubic regression implies that Carlton will win and a Quartic function implying that Adelaide will win”.
The teacher then asks the class something along the lines of, “What would make our model more accurate?”. Obviously, more data points or a higher degree of Polynomial would improve the model. Here, the teacher can give the following additional information:
 Who wins now?

Who wins now?
Do the Adelaide Crows hang onto the lead?
Act Three.
Before revealing the final answer, the teacher is encouraged to find out the students’ predicted results. Then, playing the final video, posing the question of whether or not Eddie Betts will kick a goal after the siren.


Sequel
The following questions are aimed to assist the students to further analyse their model and better understand their answers.
What was your predicted final difference in score?
If you add the final score as another data point,
- How many times was there a change in the lead?
- Who led for most of the match?
- What was the biggest margin?
- How does this compare with the real statistics?


